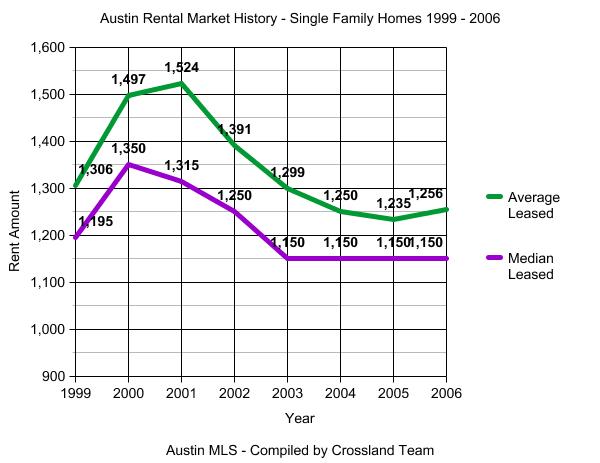
Finally, after four consecutive years of declining average rents, the Austin rental market turned around in 2006. Though only a modest increase of 1.4% over the 2005 average rental rates, it’s the change in direction that’s important. Austin absorbed 35% more rental homes in 2006 than 2005. The market is very strong but supply remained high most of the year, holding down rental increases. In a normal market, without the additional supply, an increase in demand of 35% would have resulted in a landlord’s market and we would have seen much better rent increases. The days on market for 2006 dropped 10% from an average of 60 days in 2005 to 54 days in 2006 – another indicator that rental vacancies are becoming easier to fill, though 54 days of vacancy would make most investors nervous and unhappy.
Tenants have had a sweet ride the past 5 years, and Austin rental rates still remain below the 1999 rates, but it looks like things have finally leveled out. I have the usual charts and graphs below, including a breakdown by MLS area. I’ll be working on the end of year Sales summary next and also a couple of additional stats projects I hope to complete, including a look at Duplex rental rates and sales value trends, which I’ve had a lot of requests to do. Stay tuned.
Below is the year-over-year summary for December. December rents are up 3% over last year, better than 2006 as a whole. I think we’re going to continue to see increasing increases (is that the right away to say it?) throughout 2007 as investment activity slows a bit and inventory and demand come closer to being in balance.
|
Nov 2006
|
Dec 2006
|
Dec 2005
|
Yr % Change
|
|
| # Leased |
559
|
538
|
502
|
7%
|
| Avg List Price |
$1240
|
$1248
|
$1192
|
5%
|
| Median List Price |
$1150
|
$1150
|
$1100
|
5%
|
| Avg Leased Price |
$1230
|
$1238
|
$1197
|
3%
|
| Med Leased Price |
$1150
|
$1150
|
$1095
|
5%
|
| Avg Size SQFT |
1858
|
1864
|
1811
|
3%
|
| Median SQFT |
1748
|
1747
|
1745
|
0
|
| Avg $ per SQFT |
$0.66
|
$0.65
|
$0.66
|
-2%
|
| Avg Days on Mkt |
55
|
60
|
59
|
2%
|
| Median Days on Mkt |
43
|
51
|
50
|
2%
|
Below is the chart for all of 2006 compared to all of 2005. The most interesting number to me is all of the additional rental homes that were absorbed by the market this year – a 35% increase in number of homes leased from 5,949 in 2005 to 8,042 in 2006. That’s a lot of new renters considering we’ve had a very strong sales market as well.
|
All 2006
|
All 2005
|
Yr % Change
|
|
| # Leased |
8042
|
5949
|
35%
|
| Avg List Price |
$1268
|
$1249
|
1.4%
|
| Median List Price |
$1150
|
$1150
|
0
|
| Avg Leased Price |
$1256
|
$1237
|
1.4%
|
| Med Leased Price |
$1150
|
$1150
|
0
|
| Avg Size SQFT |
1850
|
1806
|
2.4%
|
| Median SQFT |
1750
|
1701
|
2.9%
|
| Avg $ per SQFT |
$0.68
|
$0.68
|
0
|
| Avg Days on Mkt |
54
|
60
|
-10%
|
| Median Days on Mkt |
43
|
48
|
-10%
|
Below is the breakout of 2005/2006 leasing stats by MLS area. I’ve added an additional column this month. Under “# of Homes Leased” I’ve added the percent change from 2005 to 2006. This number reflects the growth or decline of homes rented in each particular MLS area. It’s interesting to see how many rentals have been added to some of the areas of Austin. There isn’t necessarily an across the board correlation in an increase in homes for rent and the rental rates. Too many other factors are at play, such as the size and price of the new rental stock being introduced into an area.
For example, area HD (Dripping Springs) has leased 115% more homes than last year, and the average rental rates are up 13% because much of that new rental stock are new homes in Belterra which lease for $1600 and up. Round Rock is up 61% in number of homes rented, and the rental rates stayed about the same. Citywide, we’re up 35%, so areas adding more than 35% are increasing the rental stock faster than the Austin area as a whole. Areas that are doing this and also seeing a drop in rental rates are generally areas with a disproportionate number of starter home neighborhoods, which also attract a lot of investors due to better cash flow ratios, but which we advise investors to stay out of.
I’ve highlighted in red the areas with falling rents. Out of these 11 areas with falling rents, 10 are east of IH35 and most are in areas with heavy growth in starter homes. The only down area west of IH35 is area LN, which is fairly far out NW of Austin, west of Cedar Park and Leander and north of Lake Travis. I’m not sure why it’s down.
I’ve highlighted in green those areas with 5% or better increases in average rental rates. Of these 20 areas with this better rent rate growth, 11 are in close proximity to Austin. Of the remaining 9, 6 have very low sample sizes (so I question their meaningfulness) and the other three are West or SW of Austin (LS, HD, HW).
I’m personally still very much in favor of a “buy close in” strategy for Austin real estate investors. The newer areas further out make me nervous for a variety of reasons. And I have a hard time believing areas like South Austin, SW Austin, and the closer in areas in NW Austin will do anything other than see steady appreciation in the coming 5 to 8 years.
If your not sure where each MLS area is located, there is an Austin MLS map at the bottom of this page which you can reference.
Feel free to post any comments, observations or questions you have about the data. Next week I should have similar charts up for sales data in Austin.
|
MLS Area
|
# of Homes Leased
|
Avg $
Amt Leased |
Avg
SQFT |
Avg $ |
Avg
Days |
Avg Yr Built
|
||||
|
2005
|
2006
|
%Chg |
2005
|
2006
|
%Chg
|
|||||
|
Area 1A
|
34
|
26
|
-24%
|
$2045
|
$2101
|
3%
|
2225
|
$0.94
|
36
|
1978
|
|
Area 1B
|
198
|
193
|
-3%
|
$1676
|
$1847
|
10%
|
1593
|
$1.16
|
44
|
1947
|
|
Area 1N
|
174
|
191
|
10%
|
$1261
|
$1370
|
9%
|
1831
|
$0.75
|
42
|
1983
|
|
Area 2
|
128
|
146
|
14%
|
$1052
|
$1152
|
9%
|
1222
|
$0.94
|
38
|
1957
|
|
Area 2N
|
117
|
133
|
14%
|
$1015
|
$1063
|
5%
|
1446
|
$0.74
|
56
|
1975
|
|
Area 3
|
137
|
169
|
23%
|
$1095
|
$1123
|
3%
|
1389
|
$0.81
|
51
|
1962
|
|
Area 3E
|
26
|
61
|
135%
|
$976
|
$1067
|
9%
|
1448
|
$0.74
|
67
|
1994
|
|
Area 4
|
132
|
161
|
22%
|
$1422
|
$1556
|
9%
|
1395
|
$1.12
|
52
|
1955
|
|
Area 5
|
83
|
147
|
77%
|
$994
|
$1011
|
2%
|
1215
|
$0.83
|
58
|
1968
|
|
Area 5E
|
40
|
70
|
75%
|
$1030
|
$1008
|
-2%
|
1674
|
$0.60
|
70
|
2002
|
|
Area 6
|
71
|
104
|
46%
|
$1359
|
$1390
|
2%
|
1266
|
$1.10
|
39
|
1954
|
|
Area 7
|
37
|
28
|
-24%
|
$1455
|
$1572
|
8%
|
1439
|
$1.09
|
37
|
1957
|
|
Area 8E
|
41
|
40
|
-2%
|
$2456
|
$2631
|
7%
|
2412
|
$1.09
|
39
|
1978
|
|
Area 8W
|
89
|
93
|
4%
|
$2124
|
$2155
|
1%
|
2494
|
$0.86
|
41
|
1990
|
|
Area 9
|
26
|
20
|
-23%
|
$1140
|
$1114
|
-2%
|
1371
|
$0.81
|
41
|
1977
|
|
Area 10
|
447
|
588
|
32%
|
$1086
|
$1144
|
5%
|
1530
|
$0.75
|
43
|
1986
|
|
Area 11
|
89
|
129
|
45%
|
$985
|
$994
|
1%
|
1449
|
$0.69
|
58
|
1989
|
|
Area BA
|
75
|
74
|
-1%
|
$991
|
$982
|
-1%
|
1641
|
$0.60
|
40
|
1986
|
|
Area BL
|
-
|
-
|
-
|
-
|
-
|
-
|
-
|
-
|
-
|
-
|
|
Area BU
|
2
|
4
|
100%
|
$1042
|
$1097
|
5%
|
1589
|
$0.69
|
35
|
1985
|
|
Area BW
|
11
|
16
|
45%
|
$965
|
$971
|
1%
|
1572
|
$0.62
|
61
|
1987
|
|
Area CC
|
4
|
5
|
25%
|
$986
|
$895
|
-9%
|
1294
|
$0.69
|
29
|
1987
|
|
Area CL
|
738
|
975
|
32%
|
$1130
|
$1173
|
4%
|
1994
|
$0.59
|
53
|
2000
|
|
Area EL
|
13
|
19
|
46%
|
$914
|
$1025
|
12%
|
1890
|
$0.54
|
73
|
2001
|
|
Area FC
|
-
|
-
|
-
|
-
|
-
|
-
|
-
|
-
|
-
|
-
|
|
Area GP
|
-
|
-
|
-
|
-
|
-
|
-
|
-
|
-
|
-
|
-
|
|
Area GT
|
118
|
165
|
40%
|
$1150
|
$1181
|
3%
|
1855
|
$0.64
|
52
|
1995
|
|
Area HD
|
40
|
86
|
115%
|
$1483
|
$1675
|
13%
|
2243
|
$0.75
|
59
|
1999
|
|
Area HH
|
301
|
419
|
39%
|
$1077
|
$1078
|
0%
|
1816
|
$0.59
|
53
|
2003
|
|
Area HS
|
21
|
8
|
-62%
|
$1058
|
$1114
|
5%
|
1769
|
$0.63
|
92
|
2002
|
|
Area HU
|
177
|
273
|
54%
|
$1064
|
$1030
|
-3%
|
1884
|
$0.55
|
68
|
2004
|
|
Area HW
|
28
|
33
|
18%
|
$1124
|
$1236
|
10%
|
1741
|
$0.71
|
73
|
?
|
|
Area JA
|
2
|
3
|
50%
|
$1000
|
$1383
|
38%
|
1604
|
$0.86
|
58
|
2004
|
|
Area LC
|
-
|
-
|
-
|
-
|
-
|
-
|
-
|
-
|
-
|
-
|
|
Area LH
|
2
|
4
|
100%
|
$1047
|
$1400
|
34%
|
1928
|
$0.73
|
23
|
1983
|
|
Area LL
|
-
|
-
|
-
|
-
|
-
|
-
|
-
|
-
|
-
|
-
|
|
Area LN
|
55
|
81
|
47%
|
$1261
|
$1244
|
-1%
|
1683
|
$0.74
|
62
|
1987
|
|
Area LS
|
170
|
193
|
14%
|
$1672
|
$1767
|
6%
|
2157
|
$0.82
|
54
|
1993
|
|
Area MA
|
100
|
139
|
39%
|
$1117
|
$1041
|
-7%
|
1822
|
$0.57
|
80
|
2004
|
|
Area MC
|
-
|
-
|
-
|
-
|
-
|
-
|
-
|
-
|
-
|
-
|
|
Area N
|
161
|
172
|
7%
|
$1162
|
$1185
|
2%
|
1736
|
$0.68
|
48
|
1990
|
|
Area NE
|
100
|
199
|
99%
|
$1060
|
$1134
|
7%
|
1799
|
$0.63
|
57
|
1997
|
|
Area NW
|
241
|
259
|
7%
|
$1211
|
$1276
|
5%
|
1916
|
$0.67
|
49
|
1986
|
|
Area PF
|
455
|
648
|
42%
|
$1197
|
$1144
|
-4%
|
1936
|
$0.59
|
62
|
2000
|
|
Area RN
|
53
|
113
|
113%
|
$2312
|
$2310
|
0%
|
2876
|
$0.80
|
53
|
2001
|
|
Area RR
|
775
|
1244
|
61%
|
$1176
|
$1186
|
1%
|
2024
|
$0.59
|
58
|
1999
|
|
Area SC
|
20
|
50
|
150%
|
$1258
|
$1186
|
-6%
|
2022
|
$0.59
|
55
|
2000
|
|
Area SE
|
33
|
64
|
94%
|
$1040
|
$1057
|
2%
|
1875
|
$0.56
|
70
|
2002
|
|
Area SV
|
6
|
6
|
0%
|
$1083
|
$940
|
-13%
|
1560
|
$0.60
|
53
|
1976
|
|
Area SW
|
311
|
415
|
33%
|
$1470
|
$1480
|
1%
|
2139
|
$0.69
|
46
|
1995
|
|
Area TC
|
9
|
16
|
78%
|
$837
|
$816
|
-3%
|
1447
|
$0.56
|
61
|
1975
|
|
Area W
|
56
|
67
|
20%
|
$1651
|
$1754
|
6%
|
2150
|
$0.82
|
58
|
1989
|
|
Area WE
|
-
|
-
|
-
|
-
|
-
|
-
|
-
|
-
|
-
|
-
|
|
Area WW
|
-
|
-
|
-
|
-
|
-
|
-
|
-
|
-
|
-
|
-
|

Steve,
Thanks for all the research, it helps to have the latest on rental stats.
Jim
Steve, what’s your opinion about trying a 5 year equity/negative cash flow play in the westlake/eanes school district area? Thanks
Hi Scott,
> what’s your opinion about trying a 5 year equity/negative cash flow play in the westlake/eanes school district area?
That would be a question for your accountant. All I can do is help you make the best guess and estimate of what your possible appreciation might be. It’s certainly a great area in Eanes and I think prices will continue to go up because of the great location and the scarcity and high cost of buildable land.
Steve
Thank you for the great summary. I am looking for an investment property that will appreciate in the next few years and will generate a positive cash flow with 10% down payment. From your experience, which areas are best to invest in: Vacancy rate