Average rents for single family homes in Austin jumped 10% in March 2007 over the same month a year ago, to $1301 per month. Median rent increased 8% to $1195, meaning half of all homes in Austin lease for more than $1195 and half for less. Average days on market for rental homes fell 18% from 62 days a year ago in March to 51 days this March. Median days on market fell 28% from 50 to 36 days, meaning half of all homes leased through the Austin MLS now rent in 36 days or less. The average price per square foot is up 4.5% from $0.66 to $0.69. The number of homes lease was down 3.6% from 653 leased in March of 2006 to 629 leased March 2007.
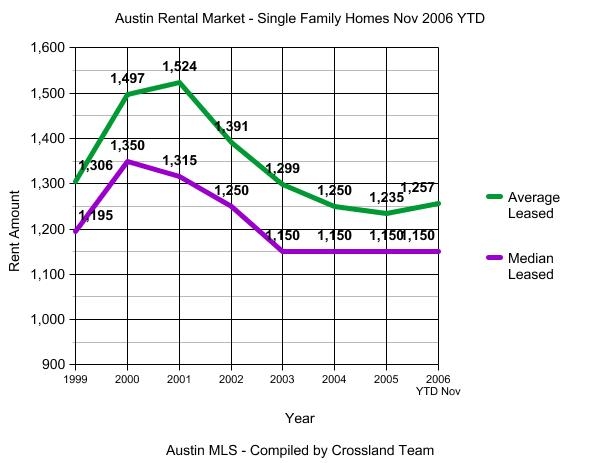
All together, this is very good news for Austin rental property owners and property managers. Rents seem to be continuing the long climb back to where they were before the tech bust and Austin’s 4 year rental market slide from 2002 through 2005. Last year, 2006 was the first year in 5 years that average rents for the year took an upward turn. It was a very slight upward turn (see graph below), but it marked the end of a rough 4 years of declining rent rates.
As we’ve completed 3 months of 2007 now, I have resumed the year-to-date breakout of rental data by MLS area. The other usual charts and graphs are below. As usual, be mindful of small sample sizes and the fact that when sample sizes in a particular area are small, the data may not reflect an accurate picture.
|
Feb 2007
|
Mar 2007
|
Mar 2006
|
Yr % Change
|
|
| # Leased |
606
|
629
|
653
|
-3.6%
|
| Avg List Price |
$1262
|
$1312
|
$1195
|
9.8%
|
| Median List Price |
$1150
|
$1200
|
$1100
|
9%
|
| Avg Leased Price |
$1250
|
$1301
|
$1182
|
10%
|
| Med Leased Price |
$1150
|
$1195
|
$1100
|
8.6%
|
| Avg Size SQFT |
1834
|
1883
|
1797
|
4.9%
|
| Median SQFT |
1766
|
1776
|
1734
|
2.4%
|
| Avg $ per SQFT |
$0.68
|
$0.69
|
$0.66
|
4.5%
|
| Avg Days on Mkt |
61
|
51
|
62
|
-18%
|
| Median Days on Mkt |
47
|
36
|
50
|
-28%
|
Below is the year-to-date summary of all rental in all areas through March 2007 compared to the year before.
|
Jan-Mar 2006
|
Jan-Mar 2007
|
Yr % Change
|
|
| # Leased |
1836
|
1883
|
2.6%
|
| Avg List Price |
$1195
|
$1271
|
6.4%
|
| Median List Price |
$1100
|
$1175
|
6.8%
|
| Avg Leased Price |
$1183
|
$1262
|
6.7%
|
| Med Leased Price |
$1100
|
$1150
|
4.5%
|
| Avg Size SQFT |
1801
|
1866
|
3.6%
|
| Median SQFT |
1730
|
1770
|
2.3%
|
| Avg $ per SQFT |
$0.66
|
$0.68
|
3.0%
|
| Avg Days on Mkt |
56
|
58
|
3.6%
|
| Median Days on Mkt |
51
|
45
|
-12%
|
Below is the full year comparison of 2005/2006 for all areas.
|
All 2006
|
All 2005
|
Yr % Change
|
|
| # Leased |
8042
|
5949
|
35%
|
| Avg List Price |
$1268
|
$1249
|
1.4%
|
| Median List Price |
$1150
|
$1150
|
0
|
| Avg Leased Price |
$1256
|
$1237
|
1.4%
|
| Med Leased Price |
$1150
|
$1150
|
0
|
| Avg Size SQFT |
1850
|
1806
|
2.4%
|
| Median SQFT |
1750
|
1701
|
2.9%
|
| Avg $ per SQFT |
$0.68
|
$0.68
|
0
|
| Avg Days on Mkt |
54
|
60
|
-10%
|
| Median Days on Mkt |
43
|
48
|
-10%
|
Below is the breakout by MLS area. Our MLS Areas changed in January 2007 so there are some new areas. See the map at the bottom of this post. Also, I’ve stopped including areas that are far outside the core of Austin as they have very little activity yet take a lot of time and effort to include.
|
MLS Area
|
# of Homes Leased
Jan-March |
Avg $
Leased Amt Jan-March |
Avg
SQFT |
Avg $ |
Avg
Days |
Avg Yr Built
|
||||
|
2006
|
2007
|
%Chg |
2006
|
2007
|
%Chg
|
|||||
|
Area 1A
|
7
|
8
|
14%
|
$1946
|
$2486
|
28%
|
2747
|
$0.90
|
84
|
1979
|
|
Area 1B
|
19
|
17
|
-10%
|
$1869
|
$2010
|
8%
|
1552
|
$1.30
|
48
|
1948
|
|
Area 1N
|
55
|
32
|
-42%
|
$1283
|
$1417
|
10%
|
1894
|
$0.75
|
46
|
1983
|
|
Area 2
|
31
|
24
|
-23%
|
$1073
|
$1209
|
13%
|
1186
|
$1.02
|
37
|
1958
|
|
Area 2N
|
33
|
35
|
6%
|
$1023
|
$1024
|
0%
|
1383
|
$0.74
|
60
|
1973
|
|
Area 3
|
31
|
32
|
3%
|
$1051
|
$1062
|
1%
|
1289
|
$0.82
|
59
|
1967
|
|
Area 3E
|
12
|
19
|
42%
|
$1085
|
$1078
|
-1%
|
1352
|
$0.79
|
78
|
1996
|
|
Area 4
|
32
|
41
|
28%
|
$1267
|
$1529
|
21%
|
1349
|
$1.13
|
52
|
1948
|
|
Area 5
|
35
|
34
|
3%
|
$997
|
$1016
|
2%
|
1302
|
$0.78
|
67
|
1977
|
|
Area 5E
|
19
|
15
|
-21%
|
$1032
|
$962
|
-7%
|
1587
|
$0.61
|
55
|
2002
|
|
Area 6
|
25
|
19
|
-24%
|
$1288
|
$1529
|
19%
|
1471
|
$1.04
|
25
|
1964
|
|
Area 7
|
10
|
4
|
-60%
|
$1502
|
$1323
|
-13%
|
1127
|
$1.17
|
18
|
1951
|
|
Area 8E
|
10
|
8
|
-20%
|
$2146
|
$2948
|
37%
|
2519
|
$1.17
|
40
|
1979
|
|
Area 8W
|
11
|
11
|
0%
|
$2518
|
$2309
|
-8%
|
2581
|
$0.89
|
66
|
1990
|
|
Area 9
|
6
|
7
|
-17%
|
$1190
|
$1163
|
-2%
|
1256
|
$0.93
|
66
|
1976
|
|
Area 10N
|
32
|
39
|
22%
|
$1009
|
$1132
|
12%
|
1428
|
$0.79
|
52
|
1976
|
|
Area 10S
|
100
|
85
|
-15%
|
$1106
|
$1171
|
6%
|
1604
|
$0.73
|
46
|
1989
|
|
Area 11
|
45
|
33
|
-12%
|
$956
|
$991
|
4%
|
1408
|
$0.70
|
53
|
1990
|
|
Area CLN
|
175
|
152
|
-13%
|
$1119
|
$1138
|
2%
|
1929
|
$0.59
|
58
|
2005
|
|
Area CLS
|
75
|
92
|
23%
|
$1297
|
$1371
|
6%
|
2025
|
$0.67
|
59
|
1997
|
|
Area DT
|
-
|
-
|
-
|
-
|
-
|
-
|
-
|
-
|
-
|
-
|
|
Area EL
|
9
|
8
|
-11%
|
$992
|
$952
|
-4%
|
1828
|
$0.52
|
72
|
1997
|
|
Area GTE
|
22
|
24
|
9%
|
$986
|
$1067
|
8%
|
1877
|
$0.57
|
46
|
1999
|
|
Area GTW
|
12
|
16
|
33%
|
$1311
|
$1389
|
6%
|
1999
|
$0.69
|
68
|
1994
|
|
Area HD
|
12
|
13
|
8%
|
$1561
|
$1771
|
13%
|
2067
|
$0.86
|
57
|
1995
|
|
Area HH
|
107
|
122
|
14%
|
$1033
|
$1108
|
7%
|
1826
|
$0.61
|
64
|
2003
|
|
Area HU
|
65
|
92
|
41%
|
$1037
|
$1033
|
0%
|
1914
|
$0.54
|
80
|
2005
|
|
Area LN
|
16
|
11
|
-31%
|
$953
|
$1104
|
16%
|
1861
|
$0.59
|
85
|
1991
|
|
Area LS
|
38
|
62
|
63%
|
$1721
|
$1901
|
10%
|
2214
|
$0.86
|
59
|
1995
|
|
Area MA
|
41
|
39
|
-5%
|
$992
|
$1066
|
8%
|
1776
|
$0.60
|
65
|
2005
|
|
Area N
|
33
|
27
|
-18%
|
$1145
|
$1192
|
4%
|
1708
|
$0.70
|
59
|
1989
|
|
Area NE
|
52
|
56
|
8%
|
$1120
|
$1162
|
4%
|
1930
|
$0.60
|
63
|
1999
|
|
Area NW
|
49
|
43
|
12%
|
$1303
|
$1275
|
-2%
|
2027
|
$0.63
|
55
|
1987
|
|
Area PF
|
148
|
155
|
5%
|
$1128
|
$1179
|
5%
|
1995
|
$0.59
|
52
|
2001
|
|
Area RN
|
14
|
30
|
114%
|
$2071
|
$1953
|
-6%
|
2546
|
$0.77
|
95
|
2001
|
|
Area RRE
|
202
|
217
|
7%
|
$1114
|
$1177
|
6%
|
2013
|
$0.58
|
59
|
2000
|
|
Area RRW
|
69
|
80
|
16%
|
$1225
|
$1315
|
7%
|
2123
|
$0.62
|
60
|
1995
|
|
Area SC
|
11
|
13
|
18%
|
$1143
|
$1173
|
3%
|
2133
|
$0.55
|
37
|
2004
|
|
Area SE
|
20
|
16
|
-20%
|
$1024
|
$972
|
-5%
|
1728
|
$0.56
|
52
|
1994
|
|
Area SWE
|
50
|
53
|
6%
|
$1243
|
$1297
|
4%
|
1792
|
$0.72
|
42
|
2000
|
|
Area SWW
|
46
|
39
|
-15%
|
$1585
|
$1671
|
5%
|
2341
|
$0.71
|
42
|
1996
|
|
Area UT
|
6
|
6
|
0%
|
$1390
|
$2082
|
50%
|
1874
|
$1.11
|
58
|
1933
|
|
Area W
|
11
|
18
|
64%
|
$2090
|
$1623
|
-22%
|
2061
|
$0.79
|
63
|
1989
|
Below is the historic graph of average and median rents in Austin going back to 1999 through 2006.
Below is the new Austin MLS map (replaced old MLS map Jan 2007). It does not include the outskirt areas and Counties surrounding Austin.

Hi Steve,
I notice that rents in Area 5 seem to be holding steady, but are being substantially outpaced by sales price appreciation. Would you say that is typical or indicative of a neighborhood revitalization? There is and has been quite a bit of buzz among my agent partners about this area. I was surprised though, when I saw that rents only increased 2%. Seems like a lot of investor money is going in, but from the look of the rent numbers, either the sales growth is coming more from owner occupied purchases, or investors are taking a cash flow hit and looking for the appreciation pop. What are your thoughts?
Is there information of this caliber available for condos/apartments too?
Tom,
I don’t work East Austin, but I have a friend who has bought in East Austin and he is approaching it as you say – taking a big cash flow hit with the expectation of rapidly increasing appreciation. So far his bet is paying off.
We like to keep our investors (almost all out-of-towners) in the more “bread-and-butter” suburban areas like Areas 10N, 10S, SW and W. It’s simply a safer gamble in those areas with a more predictable outcome, in my opinion. So far we’ve been right about that.
Steve
> Is there information of this caliber available for condos/apartments too?
M1EK, I only track houses. I don’t know of any other sourse for this type of rental info. I mainly do it just to keep my finger on the pulse of the rental market and for our investor clients.
Steve