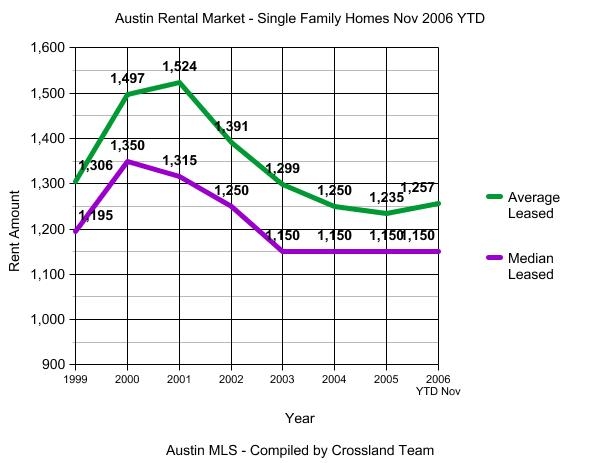
The Austin Rental Market for single family homes continues to show modest gains over a year ago. As you can see on the graph below, 2006 looks like it will be the year when rent values in Austin finally took a turn upward after falling for 4 years in a row.
See below for more charts and the complete update. This month I’ve added a new column to the MLS Area breakout of YTD Leasing stats. More on that below.
The number of homes leased through the Austin MLS is up 18% from the same time last year (559 homes Nov 2006 compared to 473 homes Nov 2005). Year to Date, the number of homes leased is up 37%, from 5448 in 2005 to 7455 in 2006. The market is showing a strong ability to absorb all of the new inventory created by investors, but the additional supply is causing rent values to rebound much slower than they would otherwise.
The Average Leased Price is up 1% both in Nov and for 2006 YTD. Not impressive, but it’s the direction of the movement that is most important after the past 4 year slide. In other words, 1% sounds unimpressive but it’s good news for landlords because of the change in direction it represents.
|
Oct 2006
|
Nov 2006
|
Nov 2005
|
Yr % Change
|
|
| # Leased |
610
|
559
|
473
|
+18%
|
| Avg List Price |
$1271
|
$1240
|
$1230
|
+1%
|
| Median List Price |
$1150
|
$1150
|
$1150
|
0
|
| Avg Leased Price |
$1257
|
$1230
|
$1216
|
+1%
|
| Med Leased Price |
$1150
|
$1150
|
$1125
|
+2%
|
| Avg Size SQFT |
1872
|
1858
|
1849
|
0
|
| Median SQFT |
1775
|
1748
|
1764
|
-1%
|
| Avg $ per SQFT |
$0.67
|
$0.66
|
$0.66
|
0
|
| Avg Days on Mkt |
52
|
55
|
62
|
-11%
|
| Median Days on Mkt |
45
|
43
|
52
|
-17%
|
|
YTD Nov
2006 |
YTD Nov 2005
|
Yr % Change
|
|
| # Leased |
7455
|
5448
|
+37%
|
| Avg List Price |
$1268
|
$1254
|
+1%
|
| Median List Price |
$1150
|
$1150
|
0
|
| Avg Leased Price |
$1257
|
$1241
|
+1%
|
| Med Leased Price |
$1150
|
$1150
|
0
|
| Avg Size SQFT |
1848
|
1806
|
+2%
|
| Median SQFT |
1750
|
1700
|
+3%
|
| Avg $ per SQFT |
$0.72
|
$0.69
|
+4%
|
| Avg Days on Mkt |
54
|
60
|
-10%
|
| Median Days on Mkt |
43
|
48
|
-10%
|
On the chart below, I’ve added new columns with figures from 2005 for Number Leased and Average Leased Price. This is so you can see an indication of which MLS Areas of Austin are showing stronger or weaker rental market activity.
For example, Hutto (area HU), where we discourage investors from buying shows a 4% drop in rental values from YTD last year. If you look at the number of units rented, it has increased 52% over last year. The average year built of a rental home in Hutto is 2004. Clearly, a lot of investors have been and continue to buy new homes in Hutto.
The number of homes rented in East Austin Area 5 has increased 100% over YTD last year, but that area has managed to eek out a 1% gain (rounded up). Area 1B, which is Central/West Austin has actually rented fewer homes this year than last, and the average rents have increased 10% over last year.
I’ve highlighted in red all of the areas that have dropped in average rent values from last year. You’ll notice that all of these areas either show an average year built of 2000 or newer, and/or are areas that are further away or on the outskirts of Austin. This is why we try to keep our investors from succumbing to the temptation to buy these cheapo starter homes out in the flat farmland areas east of Austin. The numbers look better on paper, but it’s only new the first time you rent it – after that it’s just another cheaply built home among a sea of others in a neighborhood oversold to investors.
The one exception is Area 9, which is a close-in area of South East Austin. I think this may be a sleeper area and I’m not sure why rents are down. I own a duplex over there with a great downtown view and I’ve always liked this area for it’s location. The soil is bad in that part of Austin and there are a lot of homes built in the 60’s and 70’s with bad (or weak) slabs. Talk to Centex House Levelling or any other foundation repair company and they can tell you they’ve worked on many homes in that part of Austin. Nevertheless, like the hotter “East Austin” on the other side of Town Lake, I think this area might start to get noticed more in coming years, especially the section south of Riverside and north of Ben White.
Anyway, see the stats below and feel free post any questions or observations. I’ve left blank some of the areas with little or no leasing activity.
|
MLS Area
|
# Leased
|
Avg $
Leased |
%Chg
|
Avg
SQFT |
Avg $ |
Avg
Days |
Avg Yr Built
|
||
|
2005
|
2006
|
2005
|
2006
|
||||||
|
Area 1A
|
32
|
23
|
$2049
|
$2119
|
+3%
|
2248
|
$0.94
|
50
|
1977
|
|
Area 1B
|
189
|
175
|
$1681
|
$1857
|
+10%
|
1580
|
$1.18
|
44
|
1947
|
|
Area 1N
|
157
|
177
|
$1266
|
$1373
|
+9%
|
1842
|
$0.75
|
44
|
1983
|
|
Area 2
|
118
|
138
|
$1046
|
$1155
|
+10%
|
1219
|
$0.95
|
37
|
1957
|
|
Area 2N
|
108
|
120
|
$1012
|
$1067
|
+5%
|
1449
|
$0.74
|
57
|
1975
|
|
Area 3
|
129
|
158
|
$1101
|
$1122
|
+2%
|
1386
|
$0.81
|
54
|
1962
|
|
Area 3E
|
21
|
59
|
$978
|
$1069
|
+9%
|
1439
|
$0.74
|
65
|
1994
|
|
Area 4
|
122
|
154
|
$1440
|
$1548
|
+8%
|
1373
|
$1.13
|
55
|
1955
|
|
Area 5
|
71
|
142
|
$1001
|
$1007
|
+1%
|
1210
|
$0.83
|
57
|
1968
|
|
Area 5E
|
37
|
62
|
$1034
|
$1014
|
-2%
|
1673
|
$0.61
|
70
|
2002
|
|
Area 6
|
67
|
101
|
$1358
|
$1386
|
+2%
|
1259
|
$1.10
|
41
|
1953
|
|
Area 7
|
35
|
28
|
$1454
|
$1572
|
+8%
|
1439
|
$1.09
|
37
|
1957
|
|
Area 8E
|
37
|
36
|
$2472
|
$2739
|
+11%
|
2460
|
$1.11
|
34
|
1979
|
|
Area 8W
|
84
|
86
|
$2107
|
$2169
|
+3%
|
2508
|
$0.85
|
42
|
1990
|
|
Area 9
|
23
|
18
|
$1130
|
$1112
|
-2%
|
1390
|
$0.80
|
39
|
1976
|
|
Area 10
|
419
|
553
|
$1086
|
$1144
|
+5%
|
1534
|
$0.75
|
43
|
1986
|
|
Area 11
|
78
|
120
|
$980
|
$993
|
+1%
|
1447
|
$0.69
|
58
|
1989
|
|
Area BA
|
67
|
71
|
$995
|
$978
|
-2%
|
1635
|
$0.60
|
40
|
1986
|
|
Area BL
|
-
|
-
|
-
|
-
|
-
|
-
|
-
|
-
|
-
|
|
Area BU
|
-
|
-
|
-
|
-
|
-
|
-
|
-
|
-
|
-
|
|
Area BW
|
9
|
14
|
$1018
|
$982
|
-4%
|
1572
|
$0.62
|
54
|
1987
|
|
Area CC
|
-
|
-
|
-
|
-
|
-
|
-
|
-
|
-
|
-
|
|
Area CL
|
668
|
906
|
$1129
|
$1172
|
+4%
|
1994
|
$0.59
|
53
|
2000
|
|
Area EL
|
11
|
18
|
$963
|
$1030
|
+7%
|
1872
|
$0.55
|
75
|
2001
|
|
Area FC
|
-
|
-
|
-
|
-
|
-
|
-
|
-
|
-
|
-
|
|
Area GP
|
-
|
-
|
-
|
-
|
-
|
-
|
-
|
-
|
-
|
|
Area GT
|
109
|
152
|
$1168
|
$1179
|
+1%
|
1857
|
$0.63
|
52
|
1995
|
|
Area HD
|
37
|
80
|
$1514
|
$1649
|
+9%
|
2217
|
$0.74
|
61
|
1998
|
|
Area HH
|
271
|
385
|
$1085
|
$1079
|
-1%
|
1821
|
$0.59
|
54
|
2003
|
|
Area HS
|
20
|
8
|
$1086
|
$1114
|
+3%
|
1769
|
$0.63
|
92
|
2002
|
|
Area HU
|
161
|
245
|
$1068
|
$1032
|
-4%
|
1887
|
$0.55
|
69
|
2004
|
|
Area HW
|
27
|
27
|
$1120
|
$1263
|
+13%
|
1772
|
$0.71
|
89
|
1993
|
|
Area JA
|
-
|
-
|
-
|
-
|
-
|
-
|
-
|
-
|
-
|
|
Area LC
|
-
|
-
|
-
|
-
|
-
|
-
|
-
|
-
|
-
|
|
Area LH
|
-
|
-
|
-
|
-
|
-
|
-
|
-
|
-
|
-
|
|
Area LL
|
-
|
-
|
-
|
-
|
-
|
-
|
-
|
-
|
-
|
|
Area LN
|
55
|
77
|
$1261
|
$1249
|
-1%
|
1679
|
$0.74
|
61
|
1986
|
|
Area LS
|
160
|
175
|
$1681
|
$1755
|
+4%
|
2142
|
$0.82
|
55
|
1993
|
|
Area MA
|
92
|
126
|
$1112
|
$1040
|
-6%
|
1820
|
$0.57
|
78
|
2004
|
|
Area MC
|
-
|
-
|
-
|
-
|
-
|
-
|
-
|
-
|
-
|
|
Area N
|
142
|
165
|
$1167
|
$1180
|
+1%
|
1729
|
$0.68
|
48
|
1990
|
|
Area NE
|
89
|
188
|
$1062
|
$1142
|
+8%
|
1812
|
$0.63
|
56
|
1997
|
|
Area NW
|
214
|
241
|
$1195
|
$1276
|
+7%
|
1914
|
$0.67
|
49
|
1986
|
|
Area PF
|
417
|
580
|
$1177
|
$1145
|
-3%
|
1941
|
$0.59
|
63
|
2000
|
|
Area RN
|
50
|
109
|
$2317
|
$2318
|
0%
|
2879
|
$0.81
|
54
|
2001
|
|
Area RR
|
708
|
1148
|
$1176
|
$1184
|
+1%
|
2024
|
$0.58
|
58
|
1999
|
|
Area SC
|
16
|
42
|
$1299
|
$1213
|
-7%
|
2087
|
$0.58
|
56
|
2000
|
|
Area SE
|
31
|
60
|
$1042
|
$1053
|
+1%
|
1858
|
$0.57
|
71
|
2001
|
|
Area SV
|
-
|
-
|
-
|
-
|
-
|
-
|
-
|
-
|
-
|
|
Area SW
|
292
|
391
|
$1474
|
$1480
|
0%
|
2139
|
$0.69
|
46
|
1995
|
|
Area TC
|
8
|
15
|
$842
|
$817
|
-3%
|
1451
|
64
|
1975
|
|
|
Area W
|
52
|
60
|
$1660
|
$1697
|
+2%
|
2083
|
58
|
1988
|
|
|
Area WE
|
-
|
-
|
-
|
-
|
-
|
-
|
-
|
-
|
-
|
|
Area WW
|
-
|
-
|
-
|
-
|
-
|
-
|
-
|
-
|
-
|

The 100% increase in rented properties in Hutto (and other areas like Hutto) probably means that the drop in rental prices is much greater than 4%. My experience is that some property managers put unqualified tenants in these first time rentals who are willing to pay higher than market rates (but minimal security deposits) to get into a house. A significant number of these unqualified tenants wind up abandoning or being evicted sticking the landlord with a big make ready bill and a drop of 20 to 40% in the rent the landlord can ask of qualified tenants the second time around.
Jim,
If the investor had done due diligence before selecting a property management firm, this scenario of leasing to unqualified residents has a very slim chance of playing out. However, I did note that your operative word is “some”.
My experience has also been that the investor who uses someone other than a professional management firm (a friend, self-managed, unqualified sales agent,..) is also opening themselves up to a high chance of your scenario playing out.
Steve,
I agree with your noted changes. We continue to have problems in the red areas with long lease times and lower lease rates from a year ago. As long as the inventory stays high, desperate investors will cut rents.
That’s why I stopped working with investors. It’s getting harder and harder to find cashflow properties that aren’t on the outskirts of town where you have to deal with trashy tenants and unstable property values. It’s also nearly impossible to buy a fixer-upper and make decent profit anymore, for similar reasons.