
With all the talk and news articles about how wonderful the Austin Real Estate market is doing, I thought I’d take a look at a different set of numbers and share with you what I found.
While it’s good news that Austin is selling record numbers of homes, many homes still do not sell. How do the number of Expired and Withdrawn listings compare with the increase in numbers of homes sold? Let’s take a look.
I did a raw MLS count of the number of residential listings that sold, expired or were withdrawn between January and Oct of each year from 2001 thru 2005. I combined the Expired and Withdrawn numbers because both represent a failed or aborted sales effort, or a listing that never sold.
Let’s look at the graph below and see how the numbers turned out.
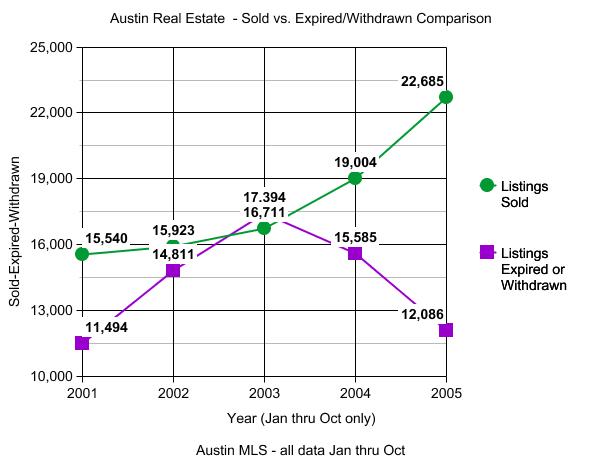
I love how graphs can tell a story better than words. Look at the Austin Real Estate market in the year 2003! Fewer than 1/2 of all listings entered into the MLS resulted in a closed sale. Compare that to where the graph is heading today. As of Oct 31 2005, almost 2 out of every three listings entered the Austin MLS resulted in a closed sale, and the trend is moving strongly toward that ratio improving even more. Look at how the lines are spreading apart between Sold and Not Sold listings.
So, while it’s good to read about how many homes are selling currently in Austin, it’s also good to see how many are NOT expiring or being withdrawn, if that makes sense.
Three years ago when we were getting more calls than we could handle from owners needing to rent their homes because they wouldn’t sell, we would try to comfort them by saying “hang on for a few years. Things will bounce back and you’ll be in a much better position to sell later down the road”. Well, it looks like we’re down the road now.
Of course there are still pockets and areas in Austin that are over-supplied with listings, but even those areas are moving in the right direction.